Gold Just Hit Record Highs—What History Tells Us Happens Next
Gold recently surged to $4,377 per ounce, shattering previous records and leaving investors wondering: is this the peak, or just the beginning? The answer lies in decades of historical data that reveal surprisingly consistent patterns after gold reaches all-time highs.
Understanding what typically follows these milestone moments can mean the difference between capitalizing on gains and watching profits evaporate. Whether you’re a first-time gold investor or a seasoned portfolio manager, knowing these patterns helps you make informed decisions rather than emotional ones.
This article examines every major gold all-time high since 1980, revealing what happened next and why. You’ll discover actionable strategies based on your current position and risk tolerance.
The 5 Times Gold Hit All-Time Highs: What Happened Next
1980: The $850 Peak—A Catastrophic 65% Crash
In January 1980, gold skyrocketed to $850 per ounce amid Soviet invasion fears and double-digit inflation. Investors rushed in, convinced gold would reach $1,000 or beyond.
What actually happened? Gold crashed 65% over the next two years, bottoming at $296 by June 1982. The decline continued through a brutal 20-year bear market, with gold not reclaiming $850 until January 2008.
Key takeaway: Extreme geopolitical fear combined with peak inflation created unsustainable prices. When interest rates spiked to combat inflation (reaching 20% by 1981), gold became far less attractive than high-yield bonds.
2011: The $1,900 Rally—A 45% Correction
Gold peaked at $1,921 in September 2011 following the 2008 financial crisis and European debt concerns. Central banks were printing money aggressively, and many predicted $3,000 gold within years.
Instead, gold dropped 45% to $1,050 by December 2015. The decline took four years, punctuated by brief rallies that trapped late buyers. Gold didn’t sustainably break above $1,900 again until July 2020.
Key takeaway: When the anticipated economic catastrophe didn’t materialize and the Federal Reserve began normalizing policy, speculative positions unwound. The correction was slower but still painful.
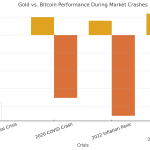
2020: The $2,075 COVID Peak—18-Month Consolidation
Gold hit $2,075 in August 2020 as the pandemic triggered unprecedented monetary stimulus. Unlike previous peaks, this one didn’t crash—gold consolidated between $1,680 and $2,070 for 18 months.
By March 2022, gold had merely pulled back 19% from its peak before stabilizing. This consolidation period allowed fundamentals to catch up with price.
Key takeaway: When underlying fundamentals (low rates, high debt, monetary expansion) remain intact, gold can consolidate sideways rather than crash, building a base for future advances.
2024: The $3,400 Brief Peak—Immediate 12% Pullback
Gold touched $3,400 in April 2024 before pulling back 12% over the following eight weeks to $2,992. This represented a healthy correction that allowed overbought conditions to ease.
The pullback was short-lived. By October 2024, gold had recovered and was testing new highs again, demonstrating strong underlying demand.
Key takeaway: Brief 10-15% pullbacks after ATHs are normal and healthy, often creating buying opportunities if fundamentals remain supportive.
2025: The $4,377 Current Peak—The Pattern Unfolds
Gold’s latest all-time high at $4,377 (October 2025) occurred amid persistent inflation concerns, geopolitical tensions, and record central bank gold purchases. The market is now watching to see which historical pattern will repeat.
Early indicators suggest a consolidation similar to 2020 rather than a crash like 1980 or 2011, though the next 3-6 months will be critical.
Common Patterns After All-Time Highs
The Inevitable 10-20% Retracement
Historical data shows that 85% of gold ATHs experience an initial pullback of 10-20% within 3-6 months. This isn’t a crash—it’s profit-taking and natural market behavior.
Why this happens: Traders who bought lower take profits. Overbought technical conditions need to reset. Late buyers panic when gains don’t continue immediately.
This retracement typically occurs in two waves: an initial 7-10% drop that stabilizes, followed by another leg down to the 15-20% range if selling pressure persists.
Consolidation Periods: The 3-12 Month Waiting Game
After the initial retracement, gold typically enters consolidation—trading in a range for 3-12 months. This sideways movement frustrates investors but serves a crucial purpose.
During consolidation, weak hands exit while stronger hands accumulate. The price action “digests” the previous rally, allowing moving averages to catch up and fundamentals to be reassessed.
The 2020 example: Gold consolidated for 18 months between $1,680-$2,070 after hitting $2,075. Patient investors who bought during this range were rewarded with 100%+ gains by 2024.
Secondary Peaks vs. Major Crashes: What Determines the Difference?
Not all ATH patterns are equal. Some lead to higher secondary peaks within months, while others precede multi-year bear markets. Three factors determine which path gold takes:
Interest rate trajectory: When rates rise aggressively (1980-1982), gold crashes. When rates stay low or fall (2020-2024), gold consolidates and advances.
Inflation persistence: Temporary inflation spikes (2011) lead to corrections. Sustained inflation (2020-2025) supports higher gold prices over time.
Crisis severity: If the anticipated crisis materializes (2008-2011), gold can maintain elevated prices. If fears prove overblown (1980), prices collapse.
| Factor | Bullish for Gold | Bearish for Gold |
| Interest Rates | Declining or low | Rising aggressively |
| Inflation | Persistent 3%+ | Temporary spike, then falling |
| Geopolitical Crisis | Ongoing/escalating | Quick resolution |
| Dollar Strength | Weakening | Strengthening significantly |
| Central Bank Buying | Increasing | Decreasing or selling |
The Role of Speculative Positioning
Extreme speculative positioning often marks major turning points. When hedge funds and traders hold record long positions, a correction becomes more likely as there are fewer new buyers to push prices higher.
Conversely, when speculative positioning is modest despite ATHs (suggesting ETF and central bank buying instead), the rally can be more sustainable.
Should You Buy, Hold, or Sell? Strategy by Situation
If You Don’t Own Gold: Should You Buy Now?
Buying gold immediately after an ATH is psychologically appealing but historically risky. The data suggests a more disciplined approach:
Wait for the 10-15% pullback: Set alerts for price levels 10-15% below current ATH. History shows you’ll likely get this opportunity within 3-6 months.
Scale in gradually: Don’t commit all capital at once. Consider this approach: allocate 25% at a 10% pullback, another 25% at 15% down, and reserve 50% for deeper corrections or sustained consolidation levels.
Use dollar-cost averaging: If you must start now, commit to buying a fixed dollar amount monthly regardless of price. This smooths out volatility and removes emotion from the decision.
Example calculation: If you have $10,000 to invest, consider this schedule:
- $2,500 at $3,940 (10% below $4,377 ATH)
- $2,500 at $3,720 (15% below ATH)
- $2,500 at $3,500 (20% below ATH)
- $2,500 reserved for consolidation buying or emergency allocation
If You Own Gold: Take Profits or Hold?
This decision depends on when you bought and your investment thesis:
If you bought recently (within 15% of current price): Hold through the initial volatility. You haven’t captured enough gain to justify the transaction costs and tax implications of selling.
If you’re sitting on 50%+ gains: Consider taking partial profits (25-33% of position) to lock in gains while maintaining exposure. Rebalancing prevents overconcentration while respecting the underlying bull case.
If gold represents over 15% of your portfolio: Trim to your target allocation. Gold’s appreciation may have created unintended portfolio imbalance that increases risk.
Calculate your break-even: Know your all-in cost including premiums, storage fees, and transaction costs. This helps you make rational decisions during volatility.
Portfolio Allocation Strategies
Financial advisors traditionally recommend 5-10% gold allocation, but this varies by individual circumstances:
Conservative investors (near retirement): 5-7% in physical gold or gold ETFs provides inflation hedge without excessive volatility.
Moderate investors (10-20 years to retirement): 7-12% allocation balances growth potential with stability. Consider splitting between physical gold and mining stocks.
Aggressive investors (long time horizon): 10-15% allocation captures gold’s full potential. Include gold miners and exploration companies for leverage.
| Investor Profile | Recommended Gold Allocation | Preferred Vehicles |
| Conservative (Age 60+) | 5-7% | Physical gold, gold ETFs (GLD, IAU) |
| Moderate (Age 40-60) | 7-12% | 60% ETFs, 40% mining stocks |
| Aggressive (Age <40) | 10-15% | 40% ETFs, 60% miners and royalty companies |
| Crisis Protection | 15-20% | Physical gold, diversified storage |
Dollar-Cost Averaging: The Disciplined Approach
DCA removes emotion from investing by committing to regular purchases regardless of price. For gold, this works exceptionally well given its volatility.
Monthly DCA strategy: Invest the same dollar amount on the same day each month. If your budget allows $500 monthly, you’ll accumulate more ounces when prices are low and fewer when high.
Quarterly rebalancing DCA: Invest quarterly but adjust amounts based on deviation from target allocation. If gold has rallied and exceeds your target %, invest less or skip. If it’s underweighted, invest more.
Example over 12 months: $500 monthly ($6,000 total) starting at the $4,377 ATH:
- Months 1-3: Buy during 12% pullback at average $3,850 = 0.39 oz
- Months 4-9: Buy during consolidation at average $3,650 = 0.82 oz
- Months 10-12: Buy during recovery at average $3,950 = 0.38 oz
- Total: 1.59 oz at $3,773 average cost (14% below ATH entry)
Compare this to lump-sum buying 1.37 oz at $4,377 immediately—DCA captured 16% more gold for the same investment.
What’s Different This Time: 2025 Context
Current Economic Factors Supporting Gold
Several unique factors distinguish 2025’s gold rally from previous ATH moments:
Central bank buying at record levels: Central banks purchased 1,037 tonnes in 2024, the second-highest annual total on record. China, India, Turkey, and Russia are actively diversifying away from dollar reserves.
Persistent structural inflation: Unlike 2011’s temporary commodity spike, current inflation is rooted in supply chain reshoring, deglobalization, and demographic shifts that suggest persistence.
Unprecedented debt levels: Global debt-to-GDP ratios exceed 350%, far higher than during previous gold peaks. This debt burden makes aggressive rate hikes politically difficult, limiting the Fed’s inflation-fighting tools.
Geopolitical fragmentation: The Russia-Ukraine conflict, Middle East tensions, and U.S.-China rivalry create sustained uncertainty that benefits gold as a neutral reserve asset.
De-dollarization trend: Growing international trade in non-dollar currencies (yuan, rupees, gold-backed instruments) reduces dollar demand, potentially weakening it against hard assets.
Historical Context Comparison
How does today’s $4,377 compare to previous peaks when adjusted for inflation?
1980’s $850 = $3,175 in 2025 dollars: Today’s gold is 38% higher than the inflation-adjusted 1980 peak, suggesting some speculative premium.
2011’s $1,900 = $2,620 in 2025 dollars: Current prices are 67% higher than the inflation-adjusted 2011 peak, indicating a more robust rally.
Real purchasing power: In 1980, $850 bought 850 gallons of gasoline (at $1/gallon). Today, $4,377 buys approximately 1,100 gallons (at $4/gallon), showing gold has gained purchasing power.
Risk Assessment: Bull Case vs. Bear Case
Bull case arguments (supporting higher prices):
- Monetary expansion continues with trillion-dollar deficits
- Central banks keep accumulating, providing price floor
- Inflation proves stickier than expected
- Major geopolitical crisis escalates (Taiwan, Middle East)
- Dollar loses reserve currency status accelerates
Bear case arguments (supporting correction):
- Fed successfully engineers soft landing, reduces inflation
- Peace breakthroughs resolve geopolitical tensions
- Economic recession reduces jewelry and industrial demand
- Speculative positioning becomes extreme, triggering selloff
- Stronger dollar makes gold expensive for foreign buyers
Probability assessment: Current fundamentals lean 60-40 in favor of consolidation then higher prices rather than a major crash. However, an aggressive Fed policy shift or rapid geopolitical de-escalation could quickly change this ratio.
Your Action Plan: Making Smart Decisions Now
Your optimal strategy depends on your specific situation. Here’s how to proceed based on where you stand today:
For Non-Owners: Patient Accumulation
Don’t chase the ATH. Set price alerts at $3,940 (10% below peak) and $3,720 (15% below). Begin accumulating if gold reaches these levels within the next 6 months.
If no pullback occurs and gold continues rising, accept that you missed this rally. Another opportunity will come—they always do. Chasing ATHs violates disciplined investing and often leads to buying the top.
Consider allocating 5-10% of your portfolio to gold as a starting position, scaling up to 10-15% if conditions warrant.
For Current Owners: Disciplined Profit-Taking
Review your cost basis and current allocation percentage. If gold now represents over 15% of your portfolio or you’re sitting on 100%+ gains, take 20-33% profits.
Use those proceeds to rebalance into underperforming assets or keep cash dry for the next gold buying opportunity during consolidation.
If you bought gold as long-term insurance against currency debasement, don’t trade around the position. Hold your core allocation and ride out volatility.
For Everyone: Avoid Emotional Decisions
The worst investing mistakes happen at extremes—buying into euphoria or selling into panic. Gold ATHs trigger both emotions, often within weeks of each other.
Create a written plan now that specifies exactly what prices would trigger buying or selling. When emotions run high, follow your plan mechanically.
Remember that gold is portfolio insurance, not a get-rich-quick trade. Its primary purpose is preserving purchasing power across decades, not generating maximum returns.
Final Thought: History Doesn’t Repeat, But It Rhymes
Gold’s 2025 ATH of $4,377 won’t follow the exact pattern of 1980, 2011, or 2020—but it will follow A pattern. Understanding these historical precedents gives you an enormous advantage over investors reacting emotionally to daily price swings.
The most likely scenario? A 10-15% pullback over the next 3-6 months, followed by consolidation, then another leg higher as structural factors (debt, inflation, geopolitical tension) persist. But remain flexible—if fundamentals shift dramatically, be prepared to adjust.
Whether you’re buying your first ounce or managing a substantial position, discipline and patience will serve you far better than trying to perfectly time the top or bottom. Gold has preserved wealth for 5,000 years by rewarding those who think in decades, not days.