Update – June 22, 2025:
Since this article was published, gold has shown continued strength above $3,350. With U.S. inflation and central bank policies still in flux, we are closely watching for a potential breakout toward $3,500. This confirms our earlier projection that summer 2025 could be a critical inflection point for gold.
Gold surged past $3,400 this month — a new all-time high that left many investors asking the same question: Is this still a good time to buy?
With inflation concerns lingering, central banks accumulating reserves, and geopolitical risks climbing, gold has once again asserted its role as a global safe haven.
But how much higher can it go in 2025?
In this analysis, we break down key technical indicators, recent market activity, and macroeconomic trends to help you navigate gold’s current momentum — and what could happen next.
Analyzing gold prices as of June 17, 2025, with technicals, fundamentals, forecasts, and trading insights through year‑end.
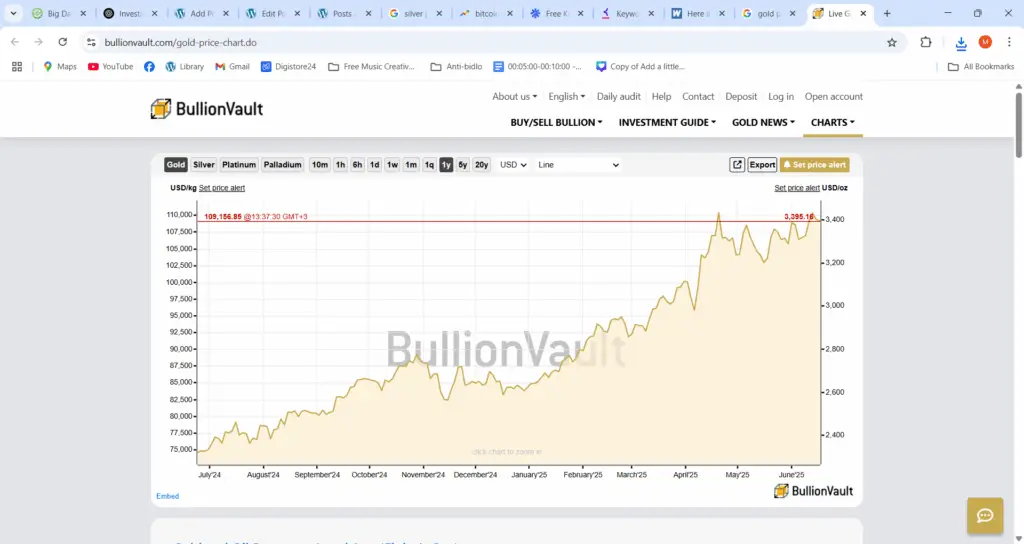
As of June 17, 2025, gold (XAU/USD) trades near $3,400 – $3,420/oz—just off recent highs. According to data, today’s spot price hovers around $3,392–$3,415 per troy ounce businessinsider.com.
Over the past month, gold has surged about 5–6%, and year-to-date it’s up 45–50%, outperforming most asset classes .
1. What’s Driving Gold’s Rally?
a) Geopolitical volatility
- Israel–Iran tensions: Recent Israeli strikes on Iran’s nuclear sites (mid‑June) spiked oil prices by up to +11% and lifted gold over 1% on June 13, reflecting a flight to safety en.wikipedia.org.
- Ongoing regional instability keeps demand high as buyers use gold as an insurance asset fortune.com+7fxstreet.com+7timesofindia.indiatimes.com+7.
b) Central bank trends & Fed policy
- Investors are closely watching the June 18 FOMC meeting. A dovish pivot with rate cuts projected later in 2025 would bolster gold via lower yields and a weaker dollar nypost.com+8fxempire.com+8cbsnews.com+8.
- Current sentiment: aggressive market positioning expecting two rate cuts in H2 2025 fxempire.com.
c) Technical structure
- Gold recently rejected key resistance at $3,440/oz, pulling back to the $3,400 support zone usagold.com+6fxstreet.com+6cfi.trade+6.
- Technicals show a sustained bullish channel, with the next upside target being the $3,500 all-time high .
d) Macro factors
- Elevated inflation, faltering dollar sentiment, and safe-haven demand continue to drive bullion higher barrons.com+15reuters.com+15economictimes.indiatimes.com+15.
- Weakening short-term US economic data (e.g., inflation, jobs) may reinforce expectations for Fed easing and support gold .
2. Technical Snapshot
| Key Levels | S/R Level | Significance |
| Resistance | $3,440–$3,450 | Near-term ceiling; await breakout |
| All-time high | ~$3,500 | Psychological & historical barrier |
| Support | $3,400 | Critical support; loss risks drop to $3,350–$3,340 |
| Deeper support | $3,350–$3,340 | Likely next floor if S/R breaks theaustralian.com.au+8fxstreet.com+8forex24.pro+8cfi.trade |
RSI levels sit near 64, showing moderate bullish momentum but inching toward overbought territory .
3. Expert Forecasts & Scenarios
A. Bull Case
- Ed Yardeni (BofA): $3,500 by year-end, and possibly $4,000+ if geopolitical tensions persist barrons.com+1investors.com+1.
- J.P. Morgan Research: Projects Q4 average at $3,675/oz, citing sustained macro/geopolitical instability jpmorgan.com.
- GovCapital: Forecasts 2025 range between $2,916–$4,352/oz—extreme upside included litefinance.org.
B. Base Case (Mixed)
- Citi Bank: Expects gold to hover $3,100–$3,500 through Q3, with an average of $3,300 short‑term. Into Q4, weak demand may push price toward $2,800 reuters.com.
- FX Empire & FXStreet: Near term sees consolidation around $3,400–$3,365, with potential retreat below $3,300 if risk appetite returns longforecast.com+12fxstreet.com+12fxempire.com+12.
C. Bear Case
- Citi – downside probability ~20%: Economic calm, better Fed outlook, stable geopolitics -> below $3,000/oz reuters.com.
- AG Thorson (FXEmpire, May): Forecasted a June pullback to $3,000, with potential deeper dip near $2,800 before another rally later in 2025 fxempire.com.
- Morningstar (Jon Mills): Predicts a 38% crash over multiple years—though less relevant for 2025 businessinsider.com.
4. Forecast Timeline: June–Dec 2025
🔹 June–July:
- Gold remains volatile: short‑term correction likely to $3,350–$3,400, unless new shocks drive prices higher.
- Watch Fed policy signals and the Middle East conflict as catalysts.
🔹 Q3 (July–Sept):
- Base average: $3,200–$3,400, with Citi seeing $3,300 short-term, but possibly dipping toward $3,000 if global sentiment improves tradingeconomics.com+1economictimes.indiatimes.com+1.
- Under continued uncertainty, rallies toward $3,500 remain possible .
🔹 Q4 (Oct–Dec):
- Bull scenario: Continued dovish Fed + geopolitical tensions → $3,500–$3,700, J.P. Morgan projects average ~$3,675 .
- Base scenario: Flattening range $3,300–$3,600, with Citi leaning bearish to sub‑$3,000 .
- Bear scenario: Risk-on environment leading to $2,800–$3,000, per Citi and FXEmpire .
Summary Forecast:
- Bullish: $3,600–$4,000 by year-end
- Base: $3,000–$3,500 range
- Bearish: $2,800–$3,000 if momentum reverses
5. Key Risk Factors
- Fed policy surprises – Dovish tone drives gold higher; hawkish surprises hurt bullion.
- Geopolitical volatility – Escalation (or calming) in Israel‑Iran region moves gold rapidly.
- Macro data – Stronger inflation or weaker US economy increases gold appeal.
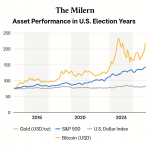
- US elections mid‑term – Political gridlock may promote safe‑haven flows.
- Sector rotation – Risk-on (stocks, bonds) could draw capital from bullion.
6. Strategic Insights for Investors
A) Trading Range Strategy
- Buy on dips into $3,350–$3,400, sell/profit-take near $3,440–$3,500.
- Use tight stop-loss below $3,350 if breakdown occurs.
B) Trend Following
- Breakout above $3,440–$3,450 with strong volume → next target $3,500–$3,600.
C) Risk-Hedging
- Allocate some portfolio to gold to hedge against inflation, dollar weakness, and geopolitical risk.
D) Physical vs. Paper Exposure
- ETFs/futures offer liquidity and lower cost. Physical gold (coins, bars) offers asset security but includes premiums, storage costs, and in some regions, tax liabilities barrons.comfxempire.com+1fxstreet.com+1en.wikipedia.org.
gold price today, gold price forecast 2025, XAU USD, gold technical analysis, gold support resistance, geopolitical safe haven, Fed rate cuts gold, buy gold 2025, gold vs inflation, gold trading strategy
📌 8. Summary
- Current price: ~$3,390–$3,415 (June 17, 2025)
- Bull case: $3,600–$4,000+ by year-end in sustained volatility
- Base range: $3,000–$3,500; Citi sees possible dip to $2,800
- Bear triggers: economic strength, stable geopolitics, Fed hawkish shift
The Geopolitical Risk Premium in Gold: Focus on the Middle East (June 2025 Deep Dive)
One of the most engaging and high-impact topics from the article is the geopolitical risk premium—specifically, how tensions between Israel and Iran and broader Middle East instability are influencing gold prices. This topic bridges market psychology, macroeconomics, and technical analysis in a way that both casual readers and seasoned investors find compelling.
📌 Introduction
As of June 2025, gold is trading near $3,400/oz, up more than 45% year-to-date, making it one of the top-performing global assets. While inflation, central bank policies, and economic uncertainty have played major roles, the most powerful single driver since April has been a surge in geopolitical risk premium, centered on the Middle East.
This deep-dive explores why gold reacts so sharply to regional conflict, how investors can interpret war-related price movements, and what to expect if tensions escalate—or ease—between Israel, Iran, and other powers.
🌍 1. What Is the Geopolitical Risk Premium?
In financial markets, a risk premium refers to the extra return investors demand to hold a risky asset—or, conversely, how much they’re willing to pay for a safe-haven asset like gold.
When conflict or instability increases in key regions:
- Investors often exit risk assets like stocks or emerging market currencies.
- They pile into gold, driving up demand and prices.
- This buying pressure inflates a “geopolitical premium”—a price tag on fear and uncertainty.
Historically, this premium can vary from 2% to over 20% depending on intensity, duration, and market expectations.
🪖 2. Why Israel–Iran Tensions Matter So Much
A) Global Oil Supply at Stake
The Iran–Israel conflict doesn’t just affect the Middle East—it threatens global energy security.
- Iran controls or can disrupt traffic through the Strait of Hormuz, through which 20% of global oil flows daily.
- Any escalation—such as missile attacks, naval skirmishes, or proxy attacks via Hezbollah or Houthis—can cause oil prices to spike 10–30%.
➡️ Higher oil → higher inflation → weaker economic outlook → bullish for gold.
B) Safe-Haven Demand Spikes
Gold is the world’s most liquid hedge against:
- War
- Currency debasement
- Central bank policy errors
- Systemic shocks
In 2024–2025, ETF inflows into gold surged following drone attacks on Israeli military bases and the retaliatory destruction of Iranian nuclear sites in early June 2025.
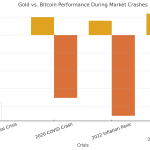
Just like during the:
- 1973 Arab-Israeli War
- 1991 Gulf War
- 2003 Iraq invasion
- 2019 U.S.-Iran strikes on Soleimani
Investors fled to gold in anticipation of broader conflict.
📉 3. Timeline of Events That Moved Gold in 2025
Let’s analyze some of the key dates and how gold responded:
| Date | Event | Impact on Gold |
| April 10 | Iranian-backed group attacks Israeli fuel terminal | Gold jumps +2.3% |
| May 2 | Israel confirms retaliatory cyberattacks on Iranian missile systems | Gold up +1.1% |
| June 13 | Israeli Air Force strikes uranium enrichment facility near Natanz | Gold spikes from $3,360 to $3,415 in 24h |
| June 14–17 | UN emergency meeting, rumors of Saudi mediation | Gold consolidates around $3,400, awaiting next move |
If we project similar scenarios:
- More escalation → rapid spike to $3,500–$3,600
- Surprise ceasefire or de-escalation → sharp pullback to $3,300–$3,250
🧭 4. How to Trade or Invest Around War-Driven Gold Movements
A) Short-Term Tactical Trading
Gold often reacts within hours of breaking news. Here’s how traders use this:
- Monitor breaking headlines via platforms like Bloomberg, Al Jazeera, or ZeroHedge.
- Use tight stop-loss orders just below major support (e.g., $3,350 in current market).
- Trade breakout levels: e.g., if gold crosses $3,440 on volume, target $3,500+.
B) Medium-Term Positioning
For swing or macro investors:
- Accumulate during pullbacks tied to temporary de-escalations.
- Hedge with long volatility or inverse equity ETFs.
- Use gold ETFs like GLD, IAU, or physical gold trusts to reduce friction.
🧠 5. Why Geopolitics Will Remain a Key Driver in H2 2025
1. No Easy Off-Ramp for Israel or Iran
- Iran’s nuclear ambitions are not going away.
- Israel has shown it’s willing to act alone.
- U.S. election-year uncertainty reduces likelihood of bold diplomacy.
2. Proxy Conflict Risk
- Hezbollah (Lebanon), Houthis (Yemen), and other Iranian allies may widen the war zone.
- Cyber warfare could escalate and affect Western financial systems.
3. Petrodollar De-dollarization Pressure
- Gold benefits if Middle East actors push oil trades away from USD, favoring gold, yuan, or digital currencies.
🪙 6. How Much of Gold’s Current Price Is Geopolitical Premium?
Analysts estimate that $200–$400/oz of today’s gold price may be driven by geopolitics.
- If Israel–Iran crisis worsens → expect $300–$600 in risk premium.
- If it resolves, the premium could vanish, dragging gold back to $3,000–$3,200 even if inflation remains high.
This means 30–50% of gold’s upside since April could unwind quickly without continued tension.
📣 7. Investor Takeaways
✅ Be nimble – Geopolitical premium can rise or collapse in hours.
✅ Monitor headlines, not just charts – Gold reacts more to breaking events than to slow-moving indicators.
✅ Diversify exposure – Pair gold with silver, energy stocks, and defense sector ETFs during high-tension periods.
✅ Consider risk reversal trades – For pros: sell gold calls at high premium, buy puts to hedge against sudden reversals.
🏁 Final Thought
The Middle East is the world’s most geopolitically sensitive region, and in 2025 it’s becoming the main fuel for gold’s surge. The Israel–Iran standoff isn’t just a regional dispute—it’s a global pressure point that injects volatility into every portfolio.
Whether you’re a trader riding 24-hour cycles or a long-term investor preserving wealth, understanding the gold–geopolitics connection is critical.