As of mid-June 2025, Bitcoin (BTC) is trading around the $105,000 level. The crypto market is witnessing increased volatility as geopolitical tensions — particularly the recent military escalations between Israel and Iran — add new layers of uncertainty. At the same time, sentiment across cryptocurrency remains neutral, according to the Fear and Greed Index. In this updated article, we’ll examine BTC’s technical setup, crypto market dynamics, margin exposure strategy, macroeconomic influences, and more.
BTC Market Snapshot: Technical Indicators and Price Action
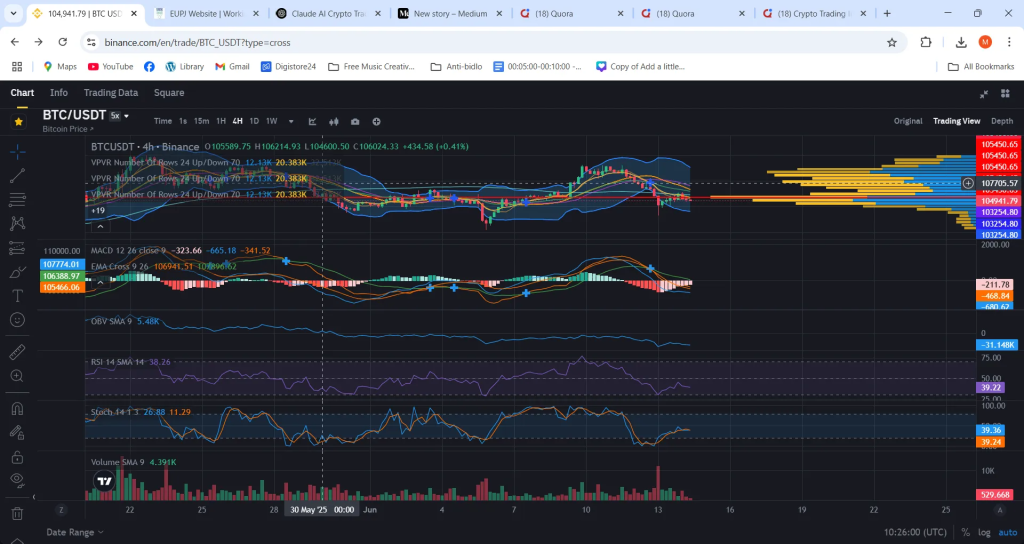
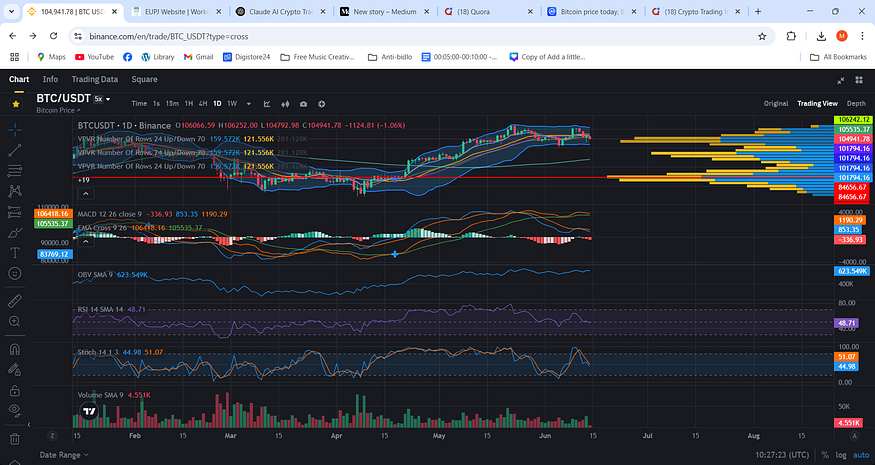
A review of BTC/USDT charts across multiple timeframes (1H, 4H, 1D, and Weekly) reveals a mixed technical picture:
- MACD: Bearish crossover confirmed on the 4-hour and daily charts. Momentum is weakening.
- Stochastic RSI: Dipping into oversold on lower timeframes, with mixed momentum on daily.
- Volume Profile (VPVR): Key resistance around $105,500–$106,000 with visible buyer interest layered between $104,000–$104,800.
- EMA & Bollinger Bands: BTC is hugging the lower Bollinger Band on several timeframes, with the 9 and 26 EMAs converging on the 1H and diverging bearishly on 4H.
- BTC appears to be consolidating within a descending triangle, with resistance stiffening near $105,500 and downside pressure mounting. Day traders and long-term investors alike are keeping a close eye on these critical zones for breakout or breakdown signals in the crypto trading arena.
Fear and Greed Index Update
As of June 14, the Fear and Greed Index reads 52 — neutral. This matches the prior week and represents a slight decline from last month’s 74 (greed). Neutral sentiment often coincides with consolidating price action and can signal indecisiveness ahead of a breakout move in the bitcoin market.
Market Depth
The depth chart shows:
- Strong buy walls around $104,000–$104,500
- Sell pressure increasing above $105,600, peaking near $106,500
This tight trading range suggests a possible breakout direction in the coming days — likely influenced by external geopolitical and macroeconomic events.
Geopolitical Risk: Israel–Iran Escalation
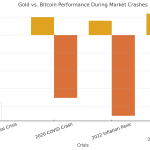
The recent conflict escalation between Israel and Iran introduces short-term global market instability. Traditional markets like NASDAQ have already reacted with a 0.85% drop over five days. Historically, bitcoin and the broader cryptocurrency market have occasionally acted as a hedge during geopolitical turmoil, though inconsistently.
Should the situation worsen, capital flight into BTC as a perceived safe-haven digital asset could drive demand upward. Conversely, if liquidity tightens due to risk-off sentiment, BTC might follow traditional financial assets lower.
Potential Scenarios:
- Escalation of Conflict: Safe-haven demand could spike, pushing BTC toward $108K–$112K quickly.
- De-escalation or Contained Conflict: Markets may stabilize, allowing BTC to resume a technical recovery if macro tailwinds (like dovish Fed posture) support it.
- Wider Proxy Involvement or Oil Disruption: Broader sell-offs across assets including crypto.
Short-Term BTC Price Forecast (Next 7–14 Days)
Bullish Case:
- Break above $106,000 could target $108,500–$110,000 region
- Confirmation needed via high volume breakout above $106.3K resistance band
- Rebound in tech stocks (NASDAQ) could support crypto rally
Bearish Case:
- Failure to hold $104,000–$104,400 support opens drop to $101,700
- RSI and MACD both trending bearish short-term, suggesting downside continuation unless macro news intervenes
Neutral Base Case:
- Sideways movement between $104,000–$106,000
- Fear and Greed Index in 50–55 range implies indecision, awaiting a catalyst
Risk Management Without Trading Advice
For those participating in crypto investing or trading with margin:
- Conservative investors using 5x margin might limit exposure to 50–60% of their account to reduce liquidation risk
- Current BTC volatility means price drops of 20%+ can still occur — setting risk tolerance is crucial
- Strategic allocation across uncorrelated crypto assets can reduce directional risk
These insights are general guidelines — not trading recommendations — and each investor must assess their own financial position and goals.
Macro & Institutional Signals
Institutional flows into bitcoin remain moderately positive, despite reduced ETF inflows in June:
- Bitcoin spot ETFs in the U.S. report stabilization rather than outflows
- Long-term wallets are accumulating BTC, with over 70% unmoved in 6+ months
- Whale transactions (over $1M) have picked up since early June
This supports a potential long-term floor near $100,000 for BTC, despite temporary volatility.
BTC Long-Term Outlook: Summer 2025
Despite near-term volatility, the long-term outlook for BTC remains constructive:
- 2024 Halving Impact: Reduced miner rewards continue tightening supply
- On-Chain Data: Strong holder base, growing institutional interest
- Geopolitical Stress: Could fuel adoption of bitcoin as digital gold
- U.S. and EU Regulation: Progress in crypto regulation is clearing legal uncertainty for institutional investors
If risk appetite returns and external tensions cool, bitcoin may test $112,000–$120,000 by Q3 2025. This depends on macro signals such as Fed policy, inflation, and bond yields.
Correlated Market Behavior: BTC vs. NASDAQ and Crypto Sector
Bitcoin (BTC) remains moderately correlated to U.S. tech indices like the NASDAQ. When equities drop sharply — such as during recent risk-off periods — BTC often follows. However, BTC also benefits disproportionately during tech rallies. The broader crypto market, especially altcoins like ETH and SUI, tends to follow BTC’s lead.
- ETH: Tracks BTC with moderate lag
- SUI: More volatile, under pressure due to token unlock schedules
- ALGO/NEAR: Occasionally used as pair trades or hedges for smaller accounts
Smart investors monitor tech stock sentiment and ETF inflows when managing BTC risk and altcoin correlations.
Upcoming Macro Events to Watch (June–July 2025)
- FOMC Rate Announcement (late June)
- U.S. CPI/PPI Inflation Data (monthly)
- Bitcoin ETF inflow/outflow reports (weekly)
- Ethereum unlock events
- Political stability in the Middle East and Ukraine
These events may act as catalysts for bitcoin and altcoin volatility, especially if they shift global risk appetite.
BTC Key Levels (as of June 14, 2025):
- Support: $104,000 → $101,700
- Resistance: $106,000 → $108,500
- Momentum: Bearish short-term, neutral mid-term
- Fear & Greed Index: 52 (Neutral)
Conclusion
Bitcoin is at a critical inflection point in June 2025. The price of BTC is navigating macroeconomic uncertainty, geopolitical instability, and evolving investor sentiment. Technical indicators suggest hesitation, while long-term fundamentals remain solid. Institutional positioning, ETF flows, and macro data will be key to determining the next major move in the cryptocurrency market.
For crypto investors and traders focused on bitcoin and altcoins, discipline, hedging, and continuous monitoring of key levels and market news will remain essential through the summer.
This article is for educational and informational purposes only. It does not constitute financial, investment, or trading advice. Always conduct your own research before making any financial decision.
Subscribe to our blog for more crypto investing insights, altcoin analysis, and bitcoin trading updates.